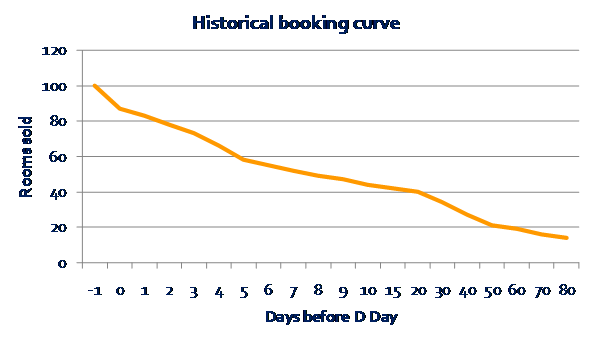
To be able to make solid revenue management decisions without any doubts, it is advisable to convert the data from your pick-up reports into graphs. A booking curve graph will help you visualize the booking pace of your hotel. hotel revenue management is about data-driven decisions.
Below an example of a popular tool used in revenue management: The Booking Curve.
All the cancellations will be taken into consideration on the reservations curve.
Identify your Hot Days (or cold Days). Is it what you expected? If not;
- Analyze
- Understand
- Can you influence it?
- How is it affecting your forecast?
- Are you loosing opportunities?
Your selling strategy affects your forecast; therefore every time you make a rate change, you should analyze the impact on your forecast. Are your actual rates affecting your booking curve in a way you did not expect? What are your trends and how they compare to your city or region?
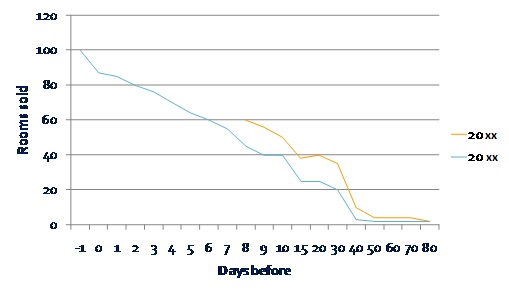
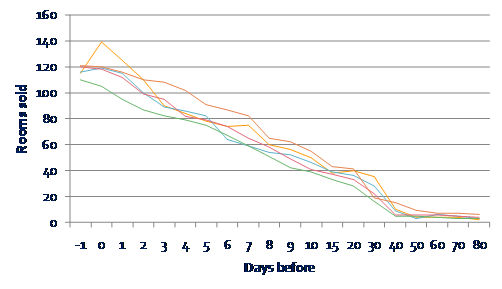
Develop a revenue management tool that allows comparison i.e. last year same day versus this year pick up or past 5 Wednesdays as per the following graph.


